Choosing thermoplastic injection molding in 2026 requires more than comparing machine prices. It demands evidence about materials, tooling, energy use, production volume, and part performance. A clear decision begins with the product’s real working conditions.
Grand View Research reports that the global injection molding market continues expanding, driven by automotive, medical, packaging, and consumer applications. MarketsandMarkets also identifies automation, lightweight components, and recycled polymers as important growth factors. However, market forecasts differ in scope and methodology. Treat them as directional evidence, not guarantees.
The details matter.
A medical housing may need tight tolerances and documented process control. An automotive clip may prioritize impact strength, cycle time, and stable pricing. A recycled thermoplastic may reduce material impact, yet introduce color variation or moisture sensitivity. Mold-flow analysis can expose weld lines before steel is cut. That small step can prevent expensive rework.
Dr. Suhas Kulkarni, founder of FimmTech and a recognized scientific molding specialist, describes the discipline as “a systematic approach to injection molding.” His point is practical: repeatable data should guide the process, not instinct alone.
Still, no selection method is perfect. Supplier capability, regional energy costs, resin availability, and future regulations can change the calculation. I would not choose a process from a spreadsheet alone. I would test representative parts, inspect molded surfaces, and review several production cycles.
This guide explains how to evaluate thermoplastic injection molding for 2026. It connects material behavior with tooling design, quality targets, sustainability goals, and total ownership cost. The best choice is rarely the cheapest quote. It is the process that remains dependable when volumes rise, designs change, and real production becomes less forgiving.
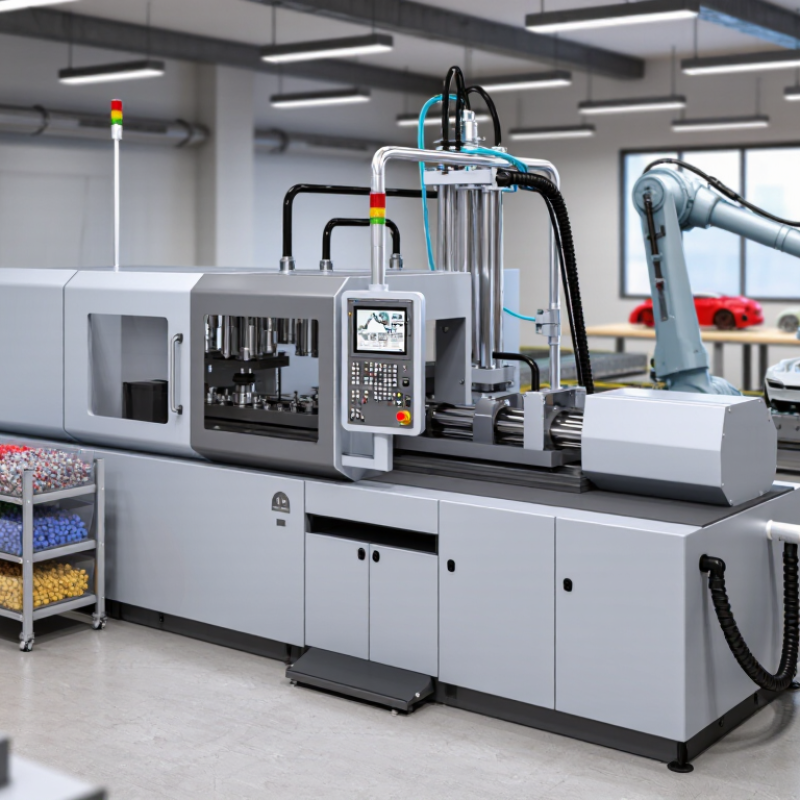
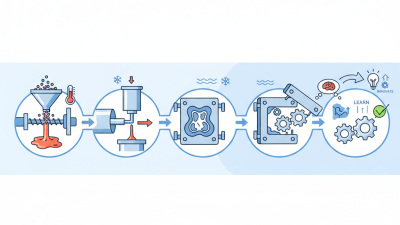
Thermoplastic injection molding melts plastic pellets, injects the melt into a closed mold, and cools the formed part.
Typical cycles last 15–60 seconds, while injection pressure can range from 20 to more than 2,000 bar. These numbers describe a process window, not a promise.
Thin walls often need rapid filling and higher pressure. Thicker parts may need slower packing to reduce sink marks. Choose the process around geometry, resin behavior, yearly volume, and surface requirements.
During a production trial, I check fill time, cushion, holding pressure, cooling, and ejection. Clamp force matters too. A 2,000-bar setting cannot repair poor venting or unbalanced runners.
That lesson is easy to miss. Low pressure is not automatically safer. Insufficient pressure can cause short shots, weld lines, or weak details.
Cycle time includes mold movement, injection, packing, cooling, and ejection. A 15-second cycle may suit a small thin part. Sixty seconds or longer may fit a larger component.
Results change with moisture, mold temperature, wall thickness, and cooling-channel design. My first estimate is often too optimistic when cooling is ignored.
Tips: Ask for a pressure trace and a complete cycle breakdown. Compare samples from repeated runs, not one attractive piece. Check dimensions after 24 hours. Leave a modest process margin.
How to Choose Thermoplastic Injection Molding in 2026?
Screen materials by melt temperature, shrinkage, and PCR content before approving a mold design. Start with the resin’s processing window. Polypropylene commonly melts near 200–280°C, while engineering polymers may require 280–400°C. These figures are typical ranges, not guarantees. Supplier datasheets and trial shots remain essential.
Shrinkage between 0.1–2.0% can change part dimensions noticeably. A 500-millimeter panel may lose up to 10 millimeters during cooling. Fiber-filled grades often shrink less in one direction, but more anisotropically. Gate location, wall thickness, packing pressure, and mold temperature also matter. ISO 294-4 provides standardized guidance for measuring molding shrinkage, yet production results still need validation.
PCR content adds another screening layer. The OECD Global Plastics Outlook reported that only about 9% of plastic waste was recycled globally in 2019. PCR can reduce virgin resin demand, but it may increase viscosity variation, color fluctuation, odor, or contamination risk. Specify a PCR percentage, such as 20% or 50%, and define acceptable batch variation. Do not assume higher PCR automatically means better sustainability. My practical view is less comfortable: a stable 30% PCR grade may outperform an inconsistent 60% grade. Test it under real cycle conditions. Resin dryness, melt residence time, and repeated regrinding deserve recorded checks.
| Material | Material Family | Typical Melt Temperature (°C) |
Typical Mold Shrinkage (%) |
Common PCR Screening Range (%) |
Key Selection Advantages | Main Design or Processing Considerations |
|---|---|---|---|---|---|---|
| ABS | Amorphous engineering thermoplastic | 220–260 | 0.4–0.8 | 10–30 | Good impact strength, surface finish, and dimensional consistency. | Drying may be required; recycled content can reduce impact strength and gloss. |
| Polypropylene (PP) | Semi-crystalline commodity thermoplastic | 200–250 | 1.0–2.0 | 10–50 | Low density, excellent chemical resistance, fatigue resistance, and low cost. | Higher shrinkage and warpage risk; PCR variability can affect flow and odor. |
| High-Density Polyethylene (HDPE) | Semi-crystalline commodity thermoplastic | 190–240 | 1.5–2.0* | 10–50 | Strong chemical resistance, toughness, moisture resistance, and easy processing. | Actual shrinkage can exceed 2.0%; compensate for crystallization and cooling conditions. |
| Polyamide 6 (PA6) | Semi-crystalline engineering thermoplastic | 240–280 | 0.7–1.5 | 10–30 | High strength, abrasion resistance, and useful temperature performance. | Highly moisture-sensitive; condition and dry resin consistently before molding. |
| Polycarbonate (PC) | Amorphous engineering thermoplastic | 280–320 | 0.5–0.7 | 10–30 | Very high impact strength, transparency options, and good dimensional stability. | Requires thorough drying; excessive residence time or moisture can cause degradation. |
| Polyoxymethylene (POM) | Semi-crystalline engineering thermoplastic | 190–230 | 1.5–2.0 | 0–15 | Excellent low friction, wear resistance, stiffness, and dimensional repeatability. | Tight thermal control is essential; PCR availability and consistency are limited. |
| Polyethylene Terephthalate (PET) | Semi-crystalline engineering thermoplastic | 260–280 | 0.2–0.8 | 10–50 | Good stiffness, chemical resistance, barrier performance, and recycled-feedstock potential. | Very moisture-sensitive; hydrolytic degradation can reduce molecular weight and strength. |
| Polybutylene Terephthalate (PBT) | Semi-crystalline engineering thermoplastic | 240–270 | 1.5–2.0 | 10–30 | Fast crystallization, good electrical insulation, chemical resistance, and surface quality. | Drying is important; glass-fiber grades can show directional shrinkage and warpage. |
| Thermoplastic Polyurethane (TPU) | Segmented elastomeric thermoplastic | 190–230 | 0.8–1.5 | 0–20 | Elasticity, abrasion resistance, flexibility, and broad hardness range. | Moisture control is critical; PCR may change hardness, color, odor, and compression set. |
How to Choose Thermoplastic Injection Molding in 2026?
Design Parts with 1.5–3 mm Walls, 0.5°–2° Draft, and Uniform Flow
Choosing thermoplastic injection molding in 2026 starts with practical part geometry. Use wall thicknesses between 1.5 and 3 mm for many standard components. This range can support faster cooling and reduce sink marks. Yet material behavior matters. Glass-filled grades may need different limits because fibers affect flow and shrinkage. Confirm the recommendation with resin data and trial shots, not drawings alone. A 2 mm wall is not automatically safe. Ribs, bosses, and thick corners can still trap heat.
Draft angles between 0.5° and 2° usually help parts release without surface damage. Textured surfaces often need more draft than polished surfaces. Deep ribs may also require careful adjustment. Small changes can prevent drag marks and ejection stress. Check the mold opening direction early. It is an easy detail to miss.
Uniform flow depends on gate location, wall transitions, and balanced filling paths. Keep thickness changes gradual instead of placing a thin section beside a heavy block. Rounded corners, preferably with practical radii, can reduce sharp stress points. Flow simulation can reveal hesitation, weld lines, or air traps before steel is cut. It is useful, but not perfect. Real molding conditions can expose surprises, including moisture, temperature drift, or uneven cooling. Review the first samples with measured dimensions, visual evidence, and clear process records.
Projected clamping area is the starting point for choosing a thermoplastic injection molding press. Measure the part’s shadow area, including runners and gates. Then multiply it by 2–5 tons per square inch. A 20 in² projected area may require roughly 40–100 tons of clamping force.
Use the lower range for shallow parts with stable molding conditions. Choose the higher range for deep cavities, higher injection pressure, large flow lengths, or materials that resist filling. Mold design also matters. Thin walls, limited vents, and uneven cooling can increase the risk of flash, even when the tonnage calculation looks acceptable.
Leave a practical safety margin, but avoid selecting an oversized press without reason. Excessive capacity can increase energy use and reduce sensitivity during process adjustments. My first estimates in production were sometimes too low because I counted only the part, not the runner system. That mistake was costly.
Check the mold’s daylight, tie-bar spacing, platen dimensions, and ejector stroke before approving the machine. The press must accept the mold physically, not just meet its tonnage target. Confirm the required shot size and injection pressure with actual material data. Resin grades can behave differently.
A trial run should verify clamp force, parting-line condition, and cycle stability. Record flash, short shots, and pressure trends. A calculation is useful. It is not the whole decision.
A capable supplier should measure critical dimensions under defined conditions. Record the temperature, humidity, conditioning time, gauge resolution, and sampling plan. Confirm measurement-system repeatability before trusting the numbers. Then evaluate process capability using Cpk, with a target of at least 1.33 for important characteristics. This target is meaningful only when the process is stable and data represents normal production. Ten excellent samples are not enough.
Look for evidence from mold trials, first-article inspections, and production records. Ask how the team controls moisture, barrel temperature, injection speed, cooling time, and tool wear. Small changes can move a dimension by tenths of a millimeter. I have seen parts pass visual inspection while missing a critical fit. That is an uncomfortable lesson. A drawing can also appear complete while hiding unrealistic tolerances. Review those assumptions with manufacturing engineers before release, and connect every critical dimension to a clear measurement method.